White Paper:
The Tao of Test Aberrance
By Dennis Maynes, Former Chief Scientist, Caveon
“As the technological sophistication of cheaters increases, it must be met with an equal or greater improvement in our tools of detection. Better statistical measures of test aberrance will help make test security a reality.”
– David Foster Ph.D., President, Caveon
What is Aberrance?
“Aberrance” is a term used to describe something unusual about the way an examinee has responded to the test questions. Aberrant test responses can arise in a variety of ways and are usually a result of the test taker’s behavior. For those who are concerned about test security, cheating behavior is the most interesting aberrant behavior. While aberrance is not synonymous with cheating on an exam or the theft of test questions, it is expected that such activities will leave an imprint and evidence in the data record. Test fraud can be observed from the way the test is taken. The assumption underlying the use of aberrance as an indicator of cheating is that the test responses of individuals engaged in test fraud will be quite different from normal test taking patterns. Aberrance is defined as a pattern of item responses that deviate from the statistical models describing normal test taking patterns.
Statistical aberrance measures need to be calibrated very carefully so they discriminate cheating from other unusual behaviors. For example, people who consistently answer the test questions quickly or who score extremely well on an exam are showing unusual test responses. But, high scores and working quickly do not imply cheating. A high score, coupled with other indicators such as extremely fast response times or low prior scores, could very well indicate prior knowledge of the test content, copying, proxy-testing or cribbing. On the other hand, individuals who answer the test questions slowly and deliberately or who score poorly on an exam also show an atypical behavior, but are not necessarily cheating. But the individual who attempts to memorize, record, or steal the test questions may exhibit an unusual pattern of responses as demonstrated by responding with the same answer choice to all questions while taking excessive amounts of time.
Even though aberrance measures have the ability to detect cheating, they must be used cautiously when explaining a specific test result, because there are many non-cheating behaviors that dilute the explanatory power of the aberrance measures. For example, individuals who are sick, fatigued or medicated may respond to a test in ways that resemble test fraud. Or, a person who has prepared poorly for an exam would most likely exhibit spotty, aberrant test-taking behavior, even though no cheating is involved. Ideally, aberrance measures optimally discriminate between innocuous, non-conforming behaviors and cheating.
Patterns of Cheating Test Taking Behavior
Some reasonable assumptions about cheaters are required in order to adjust the statistical measures for optimal cheating detection.
A particular class of cheaters is those who cheat in order to obtain a high score. If successful, this cheater will obtain a test result that misrepresents their ability by using prior knowledge of the test content or forbidden materials. This person will do very well on questions that have been primed; answering correctly in a short time period. On the other hand, when the person encounters an unknown question, they may choose a very unlikely response or take an unusual amount of time to answer the question. These inconsistencies need to be detected by the aberrance measure.
The test thief exhibits another pattern of cheating behavior that needs to be detected by the aberrance measure. This individual takes the test for the purpose of memorizing or recording the test questions for later distribution. The intent may not be to obtain a high score at all and therefore may produce a random pattern of responding. Or this person may do very well on previously seen material, but then will respond very deliberately to the questions he or she intends to disclose. Compared to other types of cheaters, there may be fewer of these. But it only takes a few people to learn and disclose an entire test. The test repeater is another test taker that will exhibit this behavior. This person learns as much of the test as possible, fails, and/or obtains a low score, and then returns; continuing in this manner until the test is passed or a higher score is obtained. The aberrance measure must be calibrated so that it detects memorization and question theft patterns.
Multiple Indices
In our research here at Caveon, we have not found an universal index that is sensitive to all kinds of aberrance. Nor have we found indices that optimally detect specific, individual types
of aberrance. This means that aberrance measures need to be created and combined, appropriately in different ways, to expose different types of aberrance and discriminate between innocuous, non-conforming behaviors and cheating. As a result, Caveon’s aberrance models carefully meld various aberrance indices.
Specific Measures of Aberrance
The most common indicators of aberrance are compiled from the pattern of the test responses. Whether the item is answered correctly or not, an aberrance index needs to evaluate the response for its suitability. Depending upon the test taker’s ability level, the selection of some responses would be very unusual (e.g. selections that are inconsistent with the examinee’s ability). The selection of very unlikely options from among those available is evidence of aberrance. In this way, an aberrance index can discriminate between wild (random) and educated guessing. If the index is tuned appropriately, it will detect other forms of aberrance, in addition to random guessing. For example, if a low-ability examinee misses a lot of easy questions, but responds correctly to many difficult questions, then the response pattern would be considered aberrant (and probably cheating). Caveon uses a combination of proprietary and publicly-available aberrance indices to measure test aberrance.
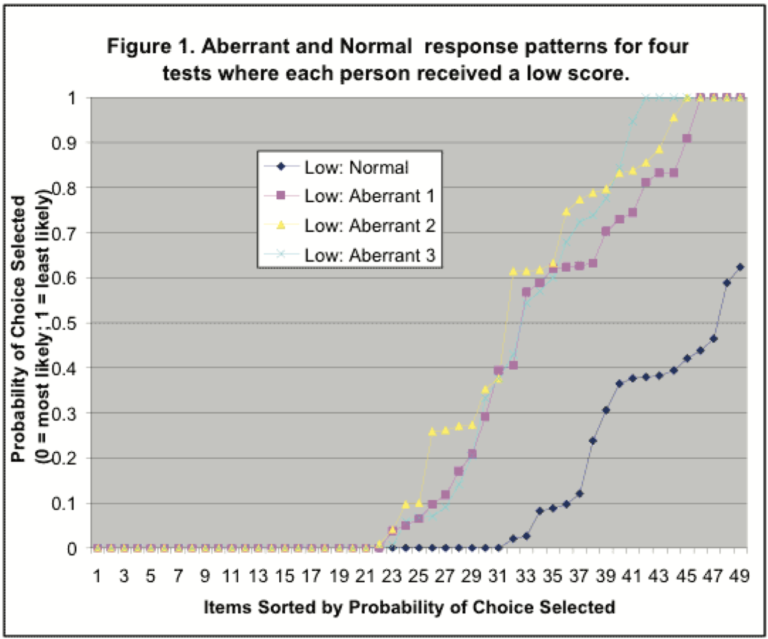
To illustrate how one measure would be used, Figure 1 shows the response choice patterns from four exams, three of which are aberrant. Each of the four is plotted after sorting on the 49 questions of the exam by the probability of the choice selected. For example, if the test taker chose the most likely response, that item received a score of 0. If the least likely response was chosen, the item value was 1. While the final scores on the test for all four were similar, their patterns were obviously different, with the individuals for the 3 aberrant tests picking options of less likelihood much more often.
Response times are a most intriguing source of data for the computation of aberrance indicators. These data are only available when the test is given by computer, but when they are available they are very rich in information. Even though many researchers have studied response times, no definitive research has been published linking response times to aberrance. Caveon’s proprietary response latency aberrance measure compares an examinee’s expected response time with actual response time. Highly unusual response-time patterns indicate aberrance. For example, an examinee who answers 84% of all the questions correctly within 10 minutes, but spends 15 to 20 minutes on a single, relatively easy, question is showing a very unusual response profile.
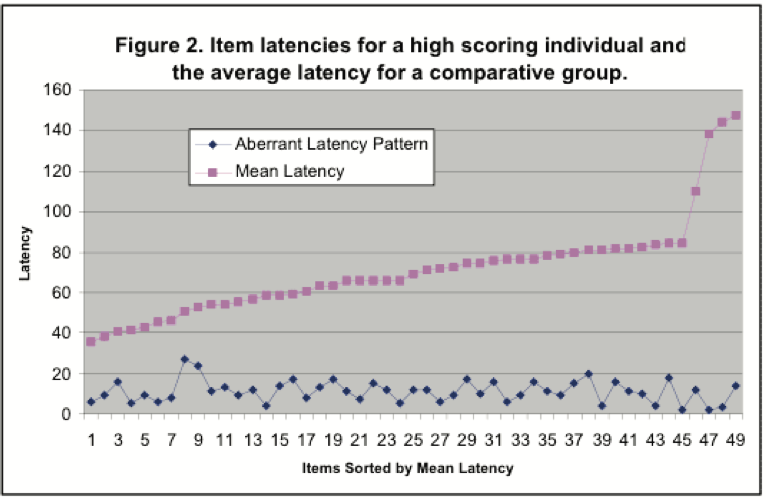
Figure 2 plots the amount of time a test taker spent on each of 49 questions. Also plotted are the average item latencies for all of the persons taking the test. By comparing an individual test with the average for everyone, it is possible to detect an aberrant pattern. Figure 2, where the data are sorted by the average latency, shows that the item latencies for the individual’s test are not similar to the average, and therefore, are aberrant.
The Power of Statistics
While aberrance measures can provide good evidence about a particular test taker, large samples and large amounts of data readily demonstrate and reveal broad and distinct patterns of aberrance that are unique to groups and subgroups. Patterns of aberrance, for example, based upon test site, training programs, specific exams, and test content are clearly observable. These patterns provide the testing program manager with information that is necessary to make decisions to help protect the testing program, the value of credentials, and the rights of the test taker, especially the honest test taker.
The Validity of Aberrance Statistics
Aberrance measures need to be validated. Validation means the performance and sensitivity of the aberrance index has been measured and characterized. Not all forms of aberrance are related to cheating; therefore, establishing the validity of aberrance indices is essential to have confidence that the measures perform as advertised.
The purpose of aberrance statistics is to aid in the classification decision: A or not A. At Caveon, the classification decision of interest is “Cheating” or “Not Cheating.” Statistical classification is done using models that describe the categories of interest. Variability in the data prevents statistical classification rules from performing perfectly. Some misclassification errors will occur. These classification errors are false-positives or false-negatives. A false-positive is the labeling of an examinee’s test response as “Cheating” when there was no cheating. On the other hand, a false-negative is failing to detect cheating that actually occurred.
Classification error rates are a direct result of how well the underlying statistical models discriminate between competing alternatives. The best models will achieve the lowest error rates and, in this sense, will have the highest validity.
The preferred method to validate models would be to use test results that are known to belong to cheaters and non-cheaters. Unfortunately, most cheaters do not announce their presence and test results that are known to result from cheating are a rare commodity.
As a second method, statisticians can use simulations and simulated data to understand statistical performance when actual data or theoretical models are not available. Simulations provide the next best way to measure statistical validity. Simulated data provides the critical information of knowing if the result is due to “simulated” cheating or not. The drawback is that simulations are only as good as the models that are used to generate the data. If the models are unrealistic, the simulations will have no validity.
A third approach for assessing validity assumes a statistical model for non-cheating test behavior and then using this hypothesis the observations are tested for lack-of-fit, outlier detection, and contamination. If non-cheating test behavior is appropriately modeled, then those test results that deviate significantly from the model will be “aberrant.” This approach (which underlies most statistical tests of hypothesis) is the basis for the derivation of Caveon’s aberrance indices. False-negative error rates are not directly obtainable when this approach is used, but the false-positive error rate can be carefully controlled and estimates of prevalence (or percent of aberrance) are possible.
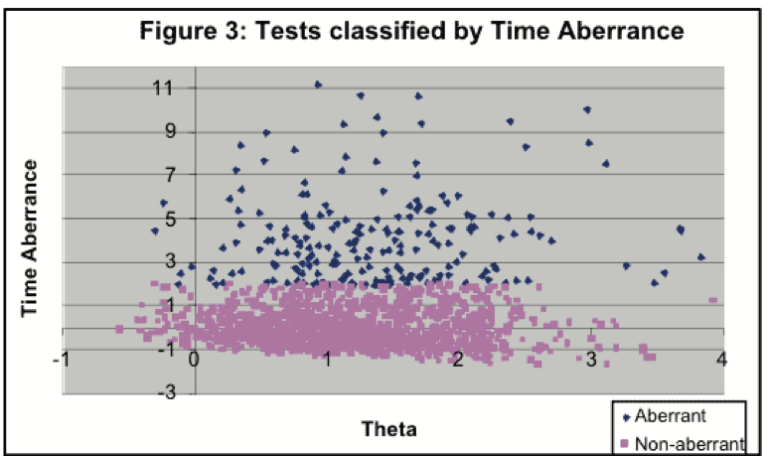
Figure 3 plots a response time aberrance measure against the test taker’s estimated ability score. Under the assumed non- cheating distribution the points that are significantly removed from the main body of the data are “aberrant.” In this particular example, 211 (14%) of 1510 tests are aberrant, when under the null distribution only 34 (2.3%) of the tests should be “aberrant.” This represents an excess aberrance of 11.7%. (Note: The four most extremely aberrant test results were not included on the plot in order to avoid compressing the main body of the scatter-plot too tightly.)
The Promise
The understanding of the statistical nature of aberrance and the development of multiple aberrance indices can help in the testing industry’s fight against what seems to be an increasing number of cheaters using more sophisticated technology and methods. Initial research at Caveon has produced promising results that such indices can detect cheating in many of its forms leading to targeted action and more effective methods of preventing the cheating in the first place.
READY TO TALK TO AN EXAM SECURITY EXPERT?
Reach out and tell us about your organization’s needs today!